You can post on LinkedIn for weeks and still feel unsure what it's doing for the business. The views look fine, the reactions trickle in, and maybe a few people comment, but the bigger question never goes away, did that post build awareness, create a lead, or just fill the feed?
That uncertainty is why LinkedIn post analytics matters. LinkedIn's own help page shows that analytics aren't just a single-post counter, because you can open post analytics for individual content and also use combined post analytics across short-form posts, images, videos, events, polls, and articles over time, which makes performance a portfolio-level view instead of a one-off snapshot (LinkedIn help on post analytics). Once you start reading the data that way, you stop asking whether a post was liked and start asking whether it moved the right audience toward the next action.
Table of Contents
- Introduction Moving Beyond Vanity Metrics
- Key LinkedIn Post Analytics Metrics Explained
- How to Interpret Your Data with Goals and Benchmarks
- Using Analytics to Optimize Your Content Strategy
- The Challenge of Connecting Analytics to Business Results
- Automating Attribution and Growth with Linqin
- Conclusion Your Path to Data-Driven Growth on LinkedIn
Introduction Moving Beyond Vanity Metrics
Many begin by refreshing the same post and mentally counting likes because that's the easiest signal to see. The problem is that impressions and reactions can make a post look healthy even when it didn't attract the right readers, the right buyers, or the right kind of attention.
LinkedIn's analytics now give a broader picture. The platform says post analytics can be opened from a post to view metrics such as impressions, and its combined post analytics rolls up performance across different content formats over time, so teams can compare what's working across an entire content mix rather than treating each post in isolation (LinkedIn help on post analytics). That matters for founders, marketers, and sales leaders because content isn't one asset, it's a system, and systems need measurement.
The practical shift is simple. Don't read LinkedIn as a popularity scoreboard. Read it as a content engine that should produce a measurable next step, whether that next step is a profile visit, a follow, a click, or a qualified conversation.
Practical rule: if a post got attention but didn't move the audience toward a business action, it may have been entertaining, not effective.
Key LinkedIn Post Analytics Metrics Explained
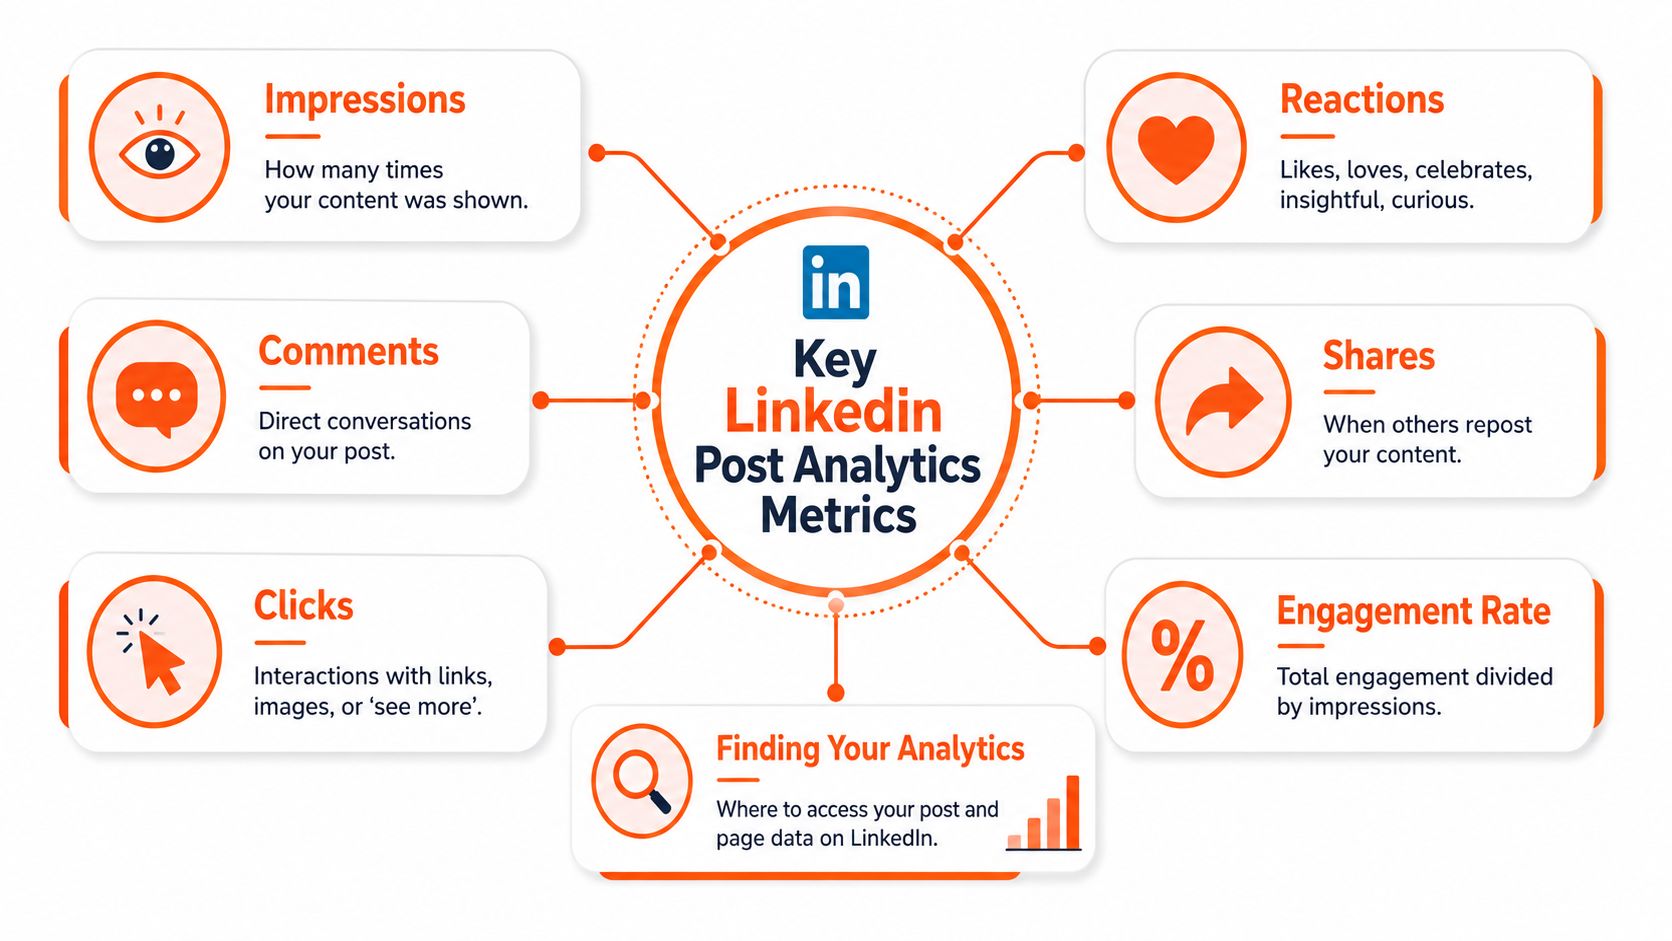
The cleanest way to read LinkedIn post analytics is to separate surface attention from downstream intent. Impressions tell you how many times your content was shown, while reactions, comments, shares, and clicks reveal how people behaved after they saw it. LinkedIn's creator analytics now also surface profile visits generated and followers gained, which were previously limited to company pages and advertisers, so personal profiles can finally track outcomes that sit closer to audience growth and lead generation (creator-level post insights).
The metrics that matter most
Engagement rate is the most useful summary metric when you need a quick read on whether a post prompted action. Industry guidance commonly treats around 2% as a good engagement rate on personal profiles, with 2% to 5% described as solid and above 5% as exceptional, while company pages are typically framed as 1% to 3% (LinkedIn post analytics benchmark guidance). That benchmark matters because a post with fewer impressions can still outperform a bigger post if it drives more meaningful interaction.
A practical analytics dashboard should also include the newer outcomes LinkedIn now exposes at the creator level. Those include profile visits generated, followers gained, and link engagement, which helps connect a post to audience growth instead of stopping at reactions alone (creator-level post insights).
For a quick orientation, think of the core signals like this:
- Impressions: Reach proxy, useful for distribution, but not proof of relevance.
- Reactions and comments: Early engagement signals, better than raw reach, but still incomplete.
- Shares: A sign the post crossed into someone else's network.
- Clicks and link engagement: Stronger evidence of intent, especially for lead gen and newsletter growth.
- Profile visits and followers gained: The clearest bridge from content to audience expansion.
If you want the official mechanics, LinkedIn's analytics interface and help documentation show where these metrics live, and the platform's post analytics pages are now supported by aggregated views across formats and time (LinkedIn help on post analytics).
The fastest way to misuse these numbers is to judge all of them equally. A post meant to build authority should be read differently from one meant to drive clicks, and the metric hierarchy should change with the goal.
LinkedIn algorithm explained growth guide
How to Interpret Your Data with Goals and Benchmarks
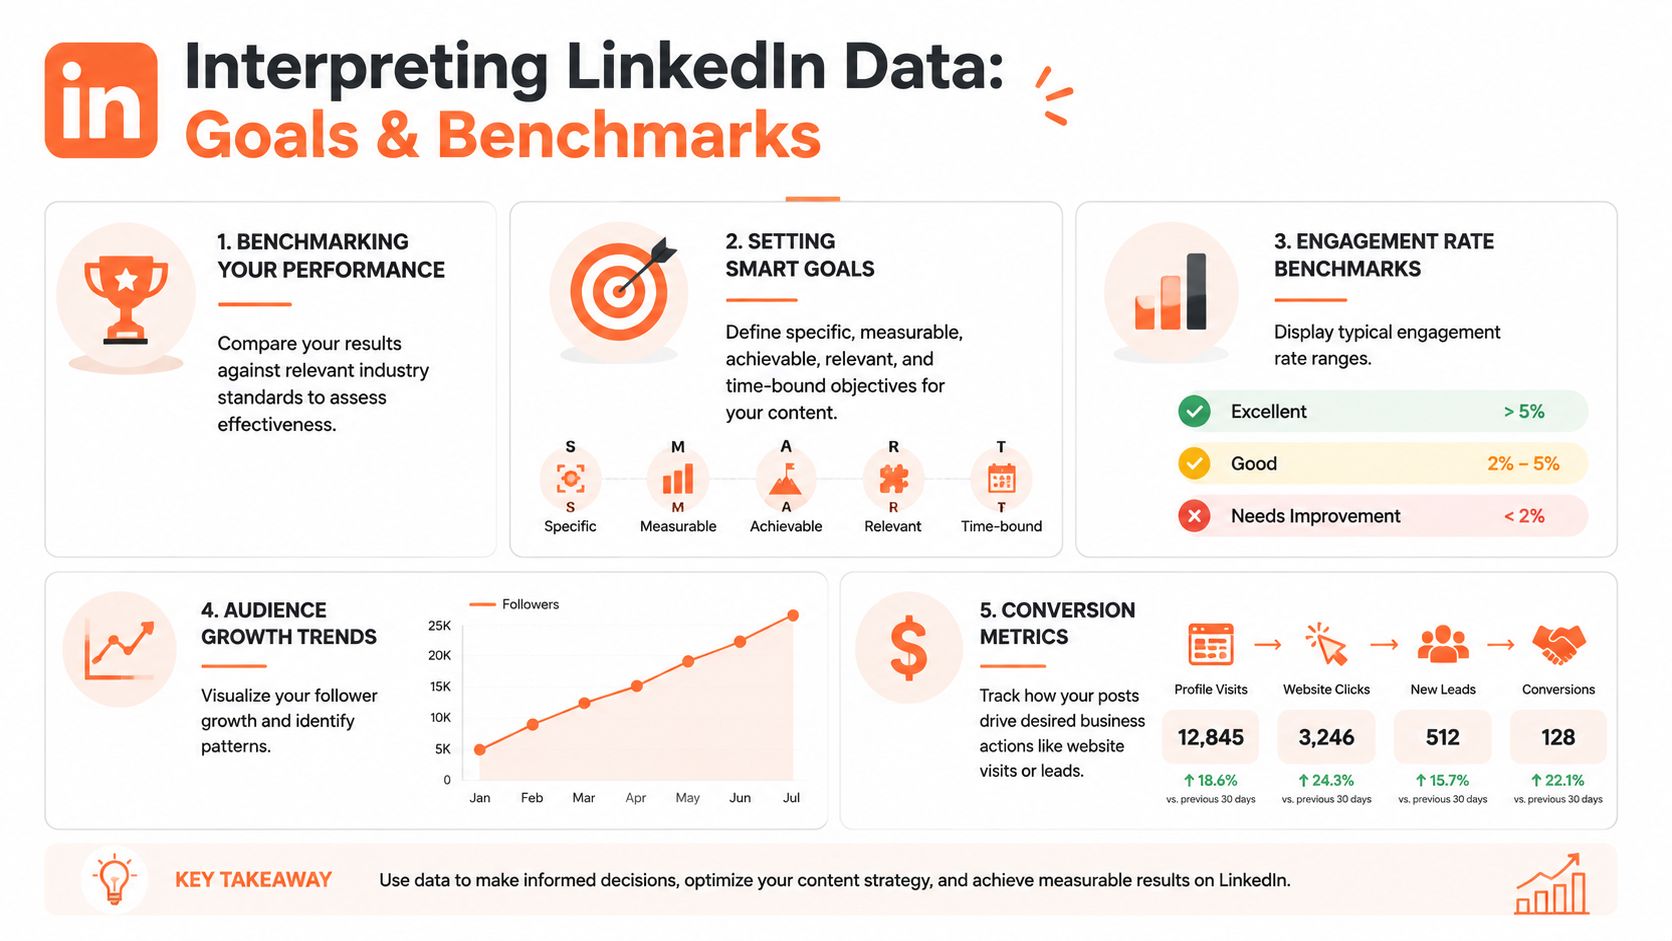
A common mistake is treating every post like it should do the same job. It shouldn't. A brand awareness post needs distribution and recall, while a lead-focused post needs clicks, profile visits, and signs that the reader is moving closer to a conversation.
Match the metric to the goal
Here's a simple way to read the data without overcomplicating it.
| Business goal | What to watch first | What to ignore first |
|---|---|---|
| Brand awareness | Impressions, shares, broad engagement | Early obsession with clicks |
| Thought leadership | Comments, engagement rate, profile visits | Vanity-only reach checks |
| Lead generation | Link engagement, clicks, profile visits, follows | Weak post-level reaction counts |
| Audience growth | Followers gained, follow rate, profile visits | Pure impression volume |
That framing lines up with LinkedIn's own shift toward richer analytics. The platform's creator-level insights now include profile visits generated, followers gained, and link engagement, which helps separate awareness from growth signals (creator-level post insights).
Use benchmarks without worshipping them
A good benchmark keeps you honest, but it shouldn't flatten context. For personal profiles, around 2% engagement is commonly treated as good, 2% to 5% as solid, and above 5% as exceptional. For company pages, 1% to 3% is typical (benchmark guidance). Use those ranges as a starting line, not a verdict.
Good benchmarking answers one question, is this post doing better than my normal baseline for this goal?
The time window matters too. If you only compare against the last few posts, you'll miss whether a format is steadily improving or just benefiting from a lucky topic. That's why a rolling baseline is more useful than a single-week spike.
Learn how posting timing affects performance
The clearest interpretation habit is to ask three questions in order. Did the post reach the intended audience, did they act on it, and did it align with the goal I assigned to it before publishing? If any one of those is missing, the post can't be called successful just because it looked busy.
Using Analytics to Optimize Your Content Strategy
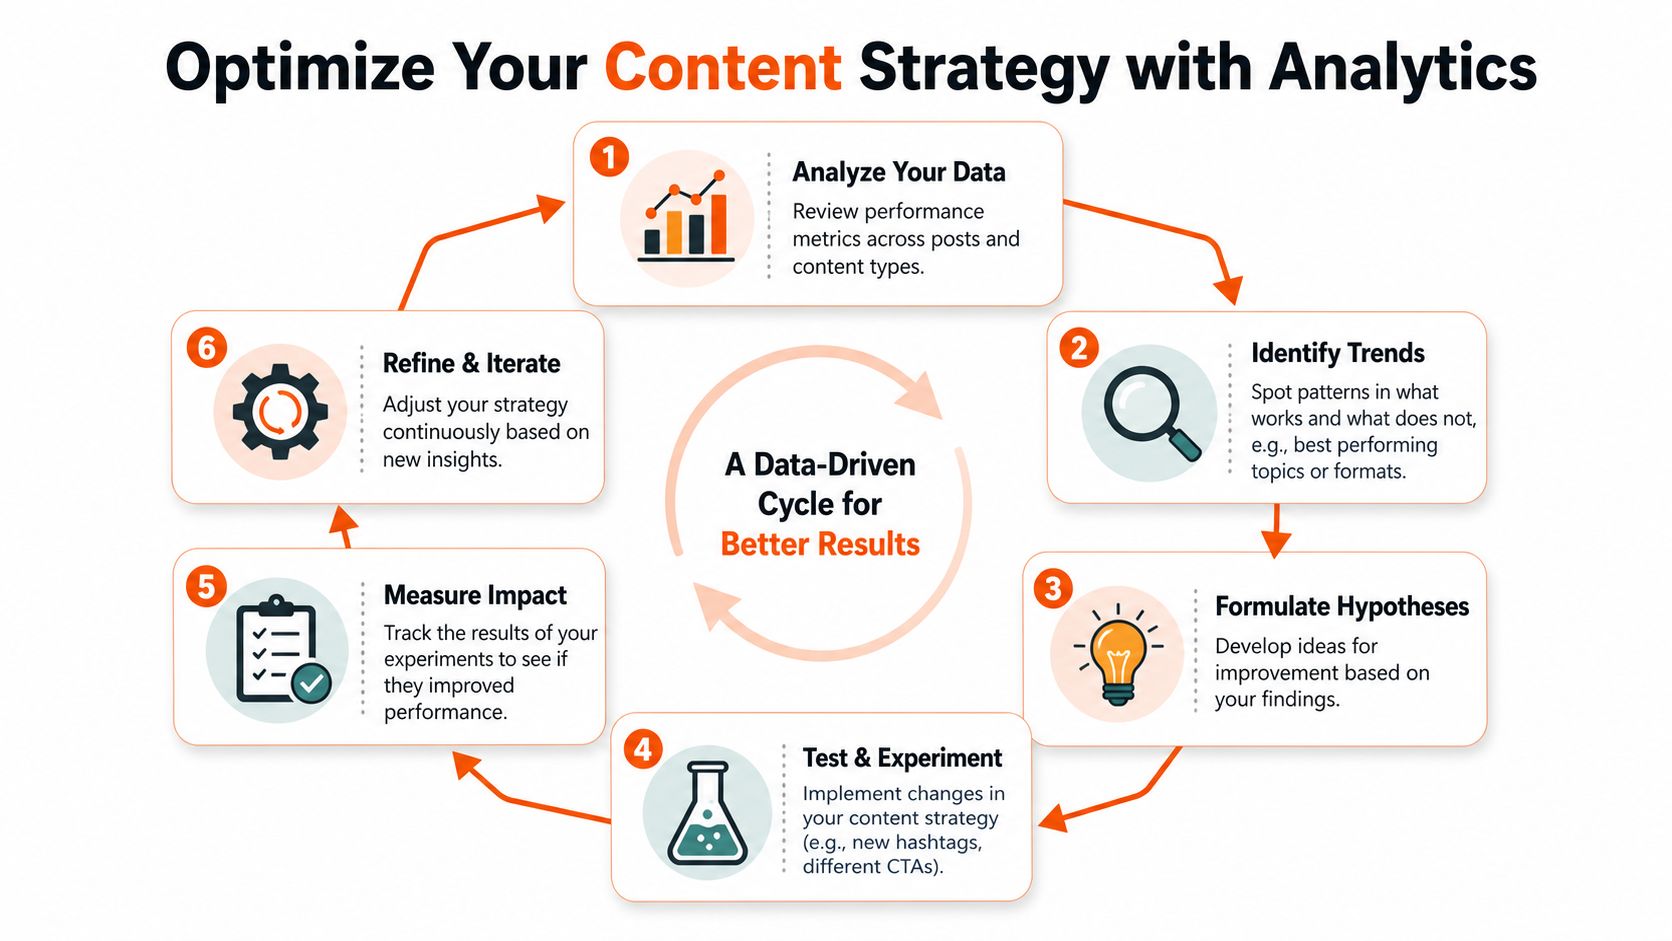
The ultimate value of LinkedIn post analytics shows up when you stop using it as a report and start using it as a feedback loop. If a certain topic consistently earns comments from the right people, that's a signal to deepen it. If a format produces reach but no profile visits, it may be attracting curiosity without moving intent.
Read beyond the first day
Posts on LinkedIn can keep gaining traction for two to three weeks, so a same-day check tells only part of the story (time-lagged analysis guidance). That long-tail lift can reshuffle your top-performing content if you compare too early. It also means that a post that looks weak on day one might become one of your strongest assets once the audience has had time to circulate it.
Audience quality matters just as much as timing. Newer guidance recommends reviewing follower quality, seniority, industry, and geography to see whether the post reached the right people, not just more people (time-lagged analysis guidance). That's especially important for B2B teams, because broad reach can feel good while still missing decision-makers.
Turn patterns into tests
Don't overhaul everything at once. Pick one variable, test it, and watch whether the numbers move in the direction that matches your goal. For example, if profile visits are the metric that matters, test one content pillar against another instead of changing the post style, topic, and call to action at the same time.
A useful operating rhythm is:
- Review the 90-day picture: benchmark your posts against a longer baseline so one strong or weak week doesn't distort your read.
- Sort by goal: awareness posts, authority posts, and lead-gen posts should sit in separate buckets.
- Check audience fit: seniority and industry tell you more than raw volume when the goal is pipeline.
- Watch the long tail: revisit performance after the initial spike has passed.
- Adjust one input: topic, format, or CTA, not all three.
That cadence works because it gives you a repeatable way to learn. It's also where post analytics becomes useful for founders and sales teams, since the question isn't whether people saw the post, it's whether the right accounts kept showing up.
Practical rule: if the audience quality is wrong, higher impressions usually mean more wasted attention.
Best time to post on LinkedIn guide
The Challenge of Connecting Analytics to Business Results
The hardest part of LinkedIn reporting is rarely collecting the numbers. It's proving that those numbers connect to something the business cares about. A post can generate profile visits, comments, and a few new followers, yet still leave you guessing whether that activity led to a warm intro, a sales conversation, or a demo request.
That gap becomes obvious when you try to do attribution manually. You end up checking LinkedIn, then your CRM, then inbox replies, then your saved lead list, then back to the original post, trying to reconstruct what happened after the engagement. The work is tedious, and the conclusion is often vague.
A practical tracking set helps, but it still doesn't solve attribution by itself. Industry guidance recommends watching engagement rate, profile visits per post, follow rate defined as new follows ÷ impressions, click-through rate, and audience seniority match, with performance compared against a 90-day average (minimum metric set). That's a solid operating list, but the main challenge is connecting those signals back to a specific comment, post, or action without spending half your day stitching tabs together.
Many teams stall out, despite knowing the metrics. They just don't have a clean way to connect them to revenue-adjacent behavior.
Automating Attribution and Growth with Linqin
Linqin is built around a comments-first model, which matters because comments on active posts create visibility before a user ever publishes their own update. The platform identifies relevant conversations, writes comments and posts in the user's voice, and links engagement back to the originating action so profile visits, replies, and impressions can be tied to a specific comment or post rather than left floating as isolated numbers.
That approach fits the attribution problem directly. Instead of wondering which activity produced the warm lead, the dashboard can show outcomes tied to the action that started the thread, and the product's analytics capability is described as attributing profile visits, replies, and impressions to individual agent actions for outcome reporting. It also includes lead tracking that turns people who engage into a warm-lead list with context from the originating comment or post.
For teams running LinkedIn seriously, that changes the workflow. You're no longer asking someone to remember which post created momentum. You're logging the action, the response, and the downstream contact path in one place, which is far more useful than a disconnected collection of reactions and visits. Linqin's Chrome extension supports that workflow inside LinkedIn, and you can learn more about it on the Linqin Chrome extension page.
The bigger shift is strategic. A comments-first system borrows reach from high-visibility posts instead of relying only on your own feed, and that makes the analytics more actionable because the engagement starts closer to the audience you want. For founders, sales leaders, and employee advocacy teams, that means LinkedIn can behave less like a black box and more like a measurable growth channel.
Conclusion Your Path to Data-Driven Growth on LinkedIn
Strong LinkedIn growth comes from reading the right signals, not chasing the loudest ones. Once you connect engagement rate, profile visits, follows, and link engagement to a clear business goal, the data becomes usable, and the content strategy becomes easier to improve.
The next step is to stop managing LinkedIn manually if your goal is repeatable growth. If you want a system that helps grow LinkedIn while you sleep, sign up for Linqin and turn post activity into tracked outcomes instead of guesswork.
A CTA for Linqin.